
GA4’s standard reports cover the basics, but real insights usually come from custom reports built around your own questions. Using Explorations and the report library, you can create tables, funnels and journeys that show exactly what matters to your business.
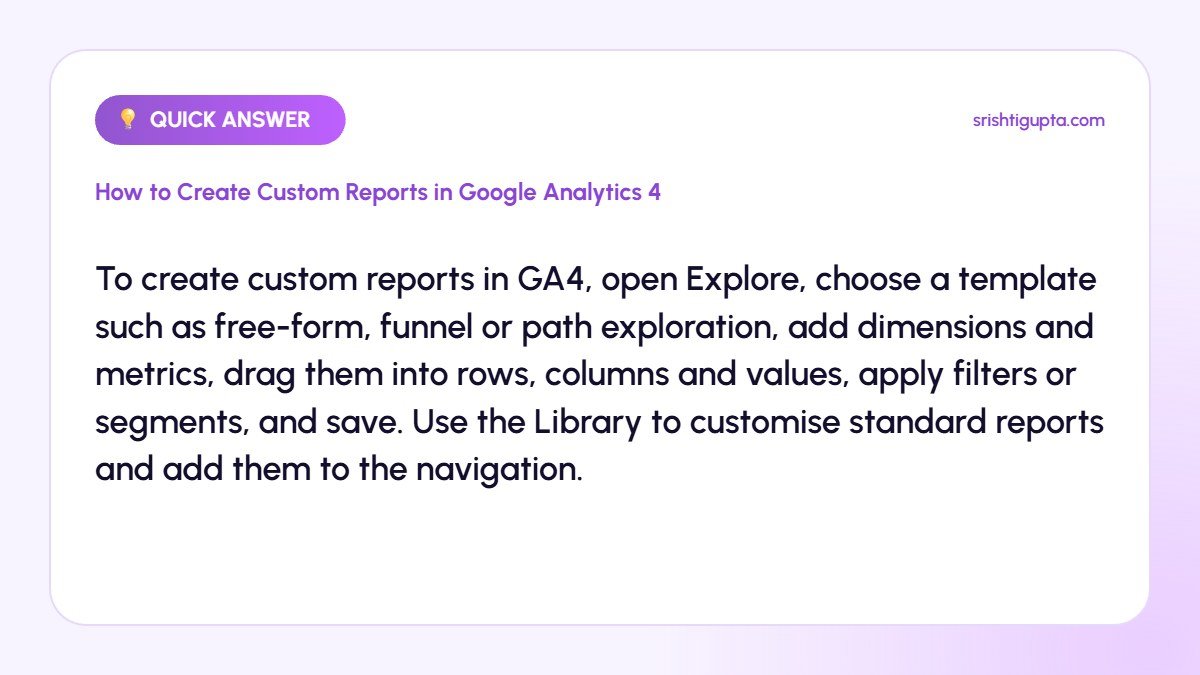
Quick answer: To create custom reports in GA4, open Explore, choose a template such as free-form, funnel or path exploration, add dimensions and metrics, drag them into rows, columns and values, apply filters or segments, and save. Use the Library to customise standard reports and add them to the navigation.
Why It Matters
Every business asks different questions, such as which blog posts generate leads or where checkout users drop off. Custom reports answer those questions directly, saving time and helping you make faster, more confident decisions.
Step-by-Step: How to Create Custom Reports in Google Analytics 4
Step 1: Write down your question
Start with a specific question like “Which landing pages bring the most leads from organic search?” Your question determines the dimensions and metrics you need.
Step 2: Open Explorations
In GA4 click Explore and choose a free-form exploration for tables and charts, funnel exploration for step-by-step journeys or path exploration to see what users do next.
Step 3: Import dimensions and metrics
Click the plus icons to add dimensions such as landing page, session source/medium or device, and metrics like sessions, engaged sessions and key events.
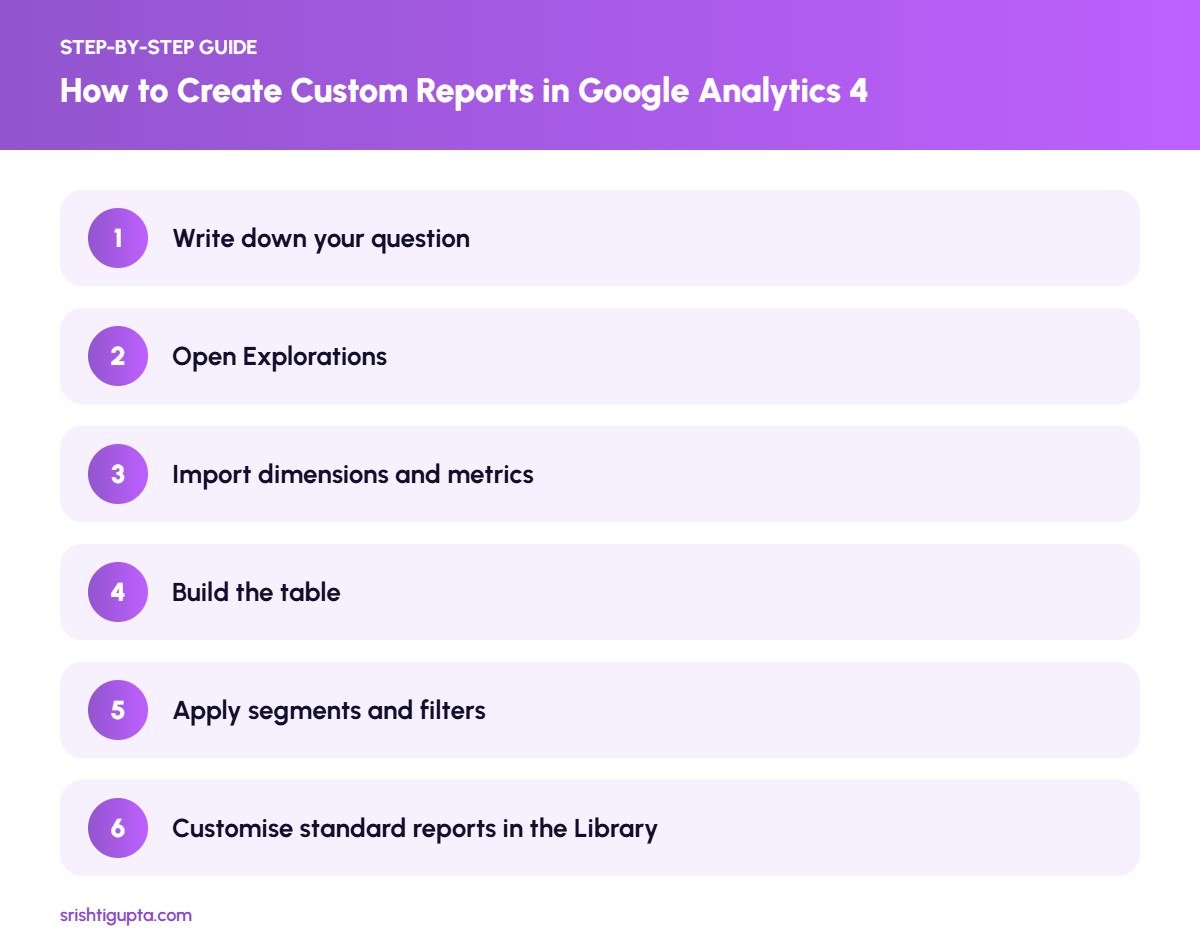
Step 4: Build the table
Drag dimensions into Rows and metrics into Values. Add a second dimension in Columns for comparisons, and switch the visualisation to a bar chart or line chart if helpful.
Step 5: Apply segments and filters
Use filters to focus on specific traffic, such as organic search only, and segments to compare groups like new versus returning users.
Step 6: Customise standard reports in the Library
For reports you check often, go to Reports, Library, create a new detail report and add it to a collection so it appears in the left navigation for your team.
Pro Tips
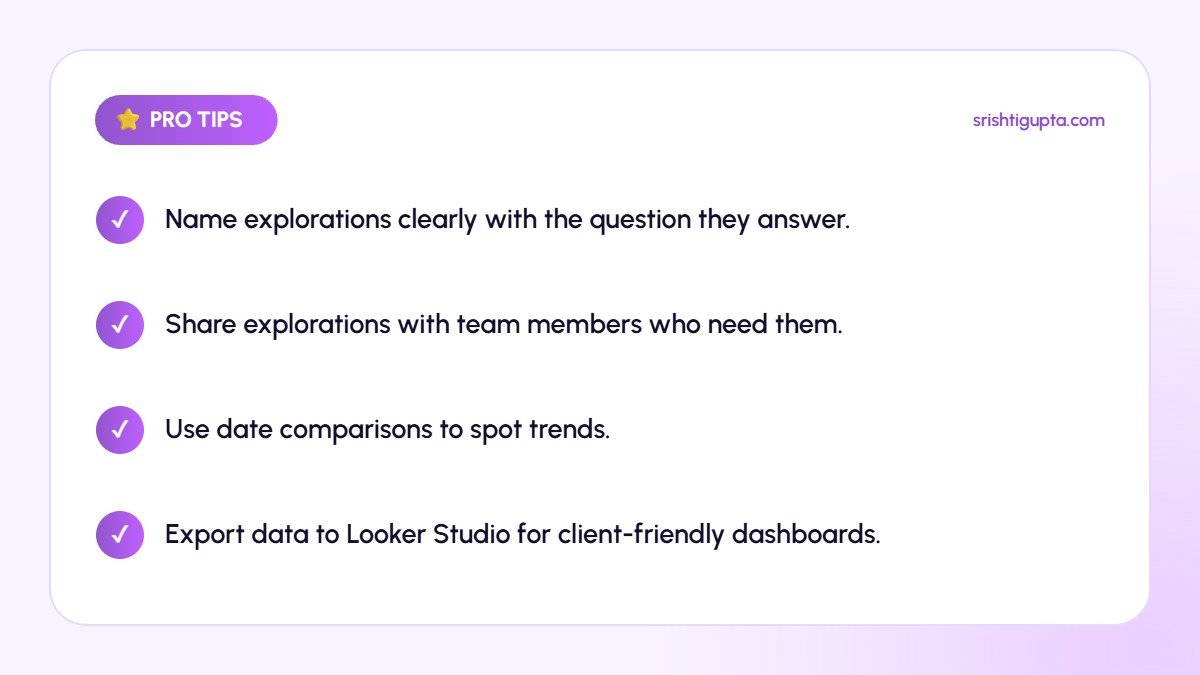
- Name explorations clearly with the question they answer.
- Share explorations with team members who need them.
- Use date comparisons to spot trends.
- Export data to Looker Studio for client-friendly dashboards.
Common Mistakes to Avoid
- Adding too many dimensions and creating unreadable tables.
- Ignoring data thresholds and sampling notices.
- Comparing metrics with different scopes incorrectly.
- Not saving useful explorations.
Frequently Asked Questions
What is the difference between Explorations and standard reports in GA4?
Standard reports are pre-built summaries, while Explorations are flexible analysis tools for building your own tables, funnels and journeys.
Can I share custom GA4 reports with clients?
Explorations can be shared with users who have access to the property. For clients, Looker Studio dashboards are usually easier to share.
Why do my GA4 exploration numbers look different from standard reports?
Differences can come from sampling, thresholds, data freshness or the scope of dimensions and metrics used.
Final Thoughts
Custom reports turn GA4 into a tool that answers your own business questions. Start with a clear question, build focused explorations and save them for repeated use, and your analytics will become far more actionable.
Need expert help? Srishti Gupta is a digital marketing expert in Ludhiana. Explore her performance marketing or get in touch to discuss your project.