
Infographics turn complicated data, processes and ideas into visuals people can understand in seconds. They are highly shareable on social media, useful in blog posts and great for earning backlinks when the information is genuinely helpful.
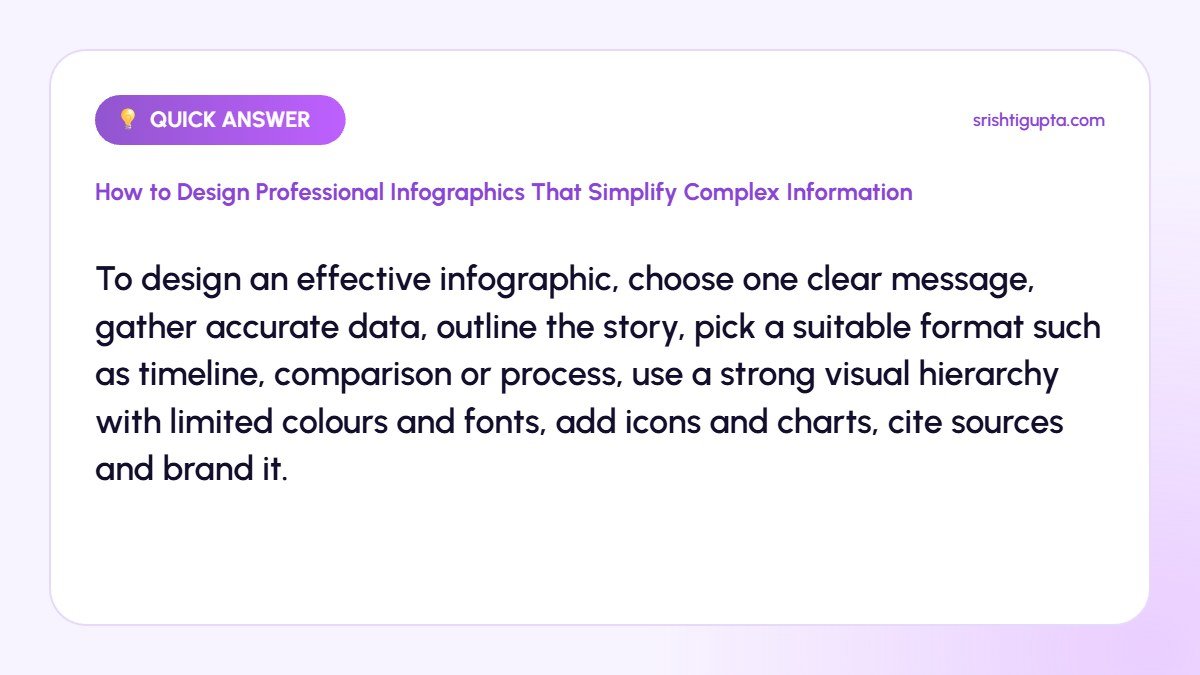
Quick answer: To design an effective infographic, choose one clear message, gather accurate data, outline the story, pick a suitable format such as timeline, comparison or process, use a strong visual hierarchy with limited colours and fonts, add icons and charts, cite sources and brand it.
Why It Matters
People remember visuals better than text alone, and busy readers often skim. A well-designed infographic communicates the key point quickly, increases engagement and makes your brand look knowledgeable and professional.
Step-by-Step: How to Design Professional Infographics That Simplify Complex Information
Step 1: Define one key message
Decide the single takeaway you want viewers to remember. Everything in the infographic should support this message, and anything else should be removed.
Step 2: Collect and verify data
Use reliable sources and recent data. Note every source so you can cite it at the bottom of the graphic and build credibility.
Step 3: Outline the story
Write the headline, sections and short text blocks before designing. A logical flow from top to bottom or left to right makes the graphic easy to follow.
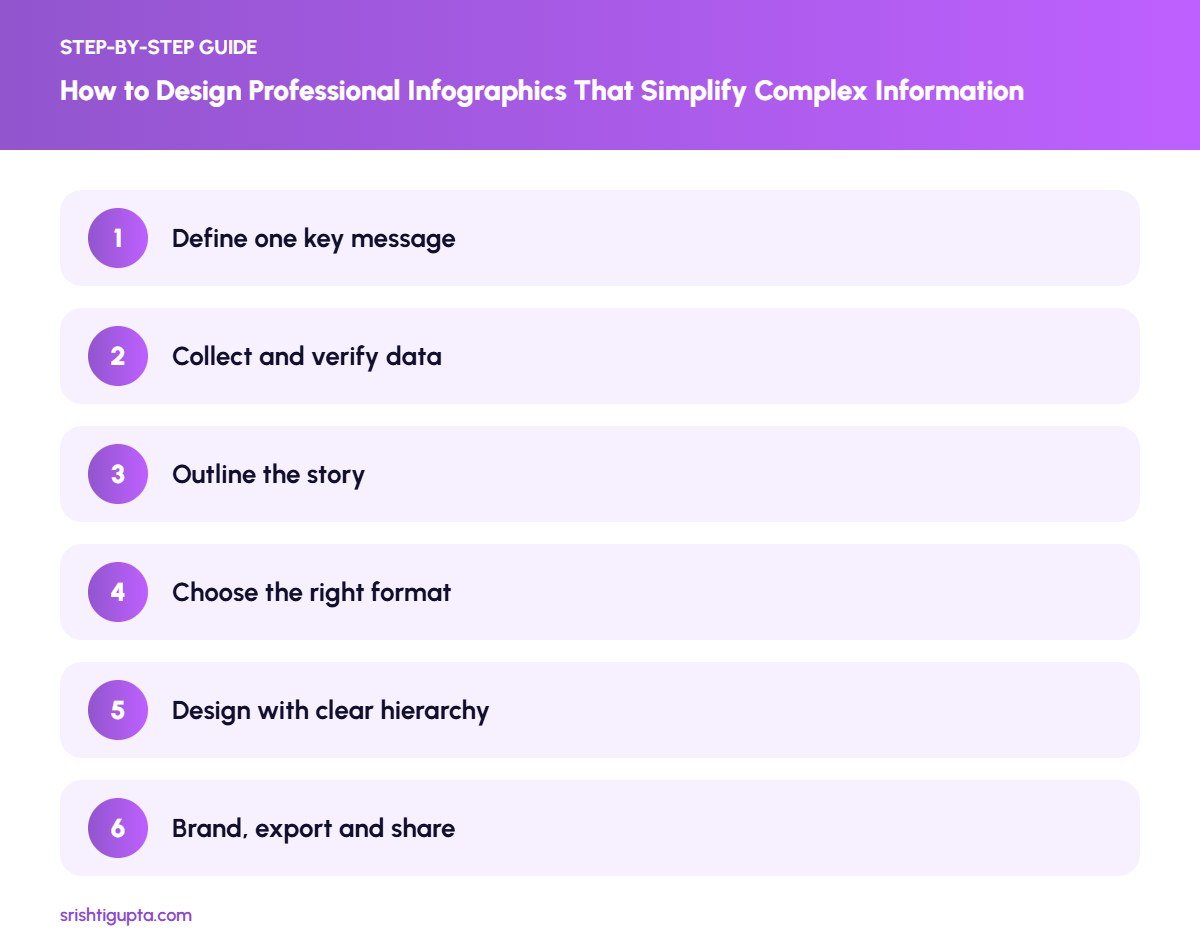
Step 4: Choose the right format
Use timelines for history, flowcharts for processes, comparisons for options, statistical layouts for numbers and lists for tips. The format should match the information.
Step 5: Design with clear hierarchy
Make the headline largest, key numbers bold and supporting text small. Limit yourself to two fonts and three or four colours, use plenty of white space and consistent icons.
Step 6: Brand, export and share
Add your logo and website subtly, export in high resolution, add descriptive alt text and share it in blog posts, Pinterest, LinkedIn and Instagram carousels.
Pro Tips
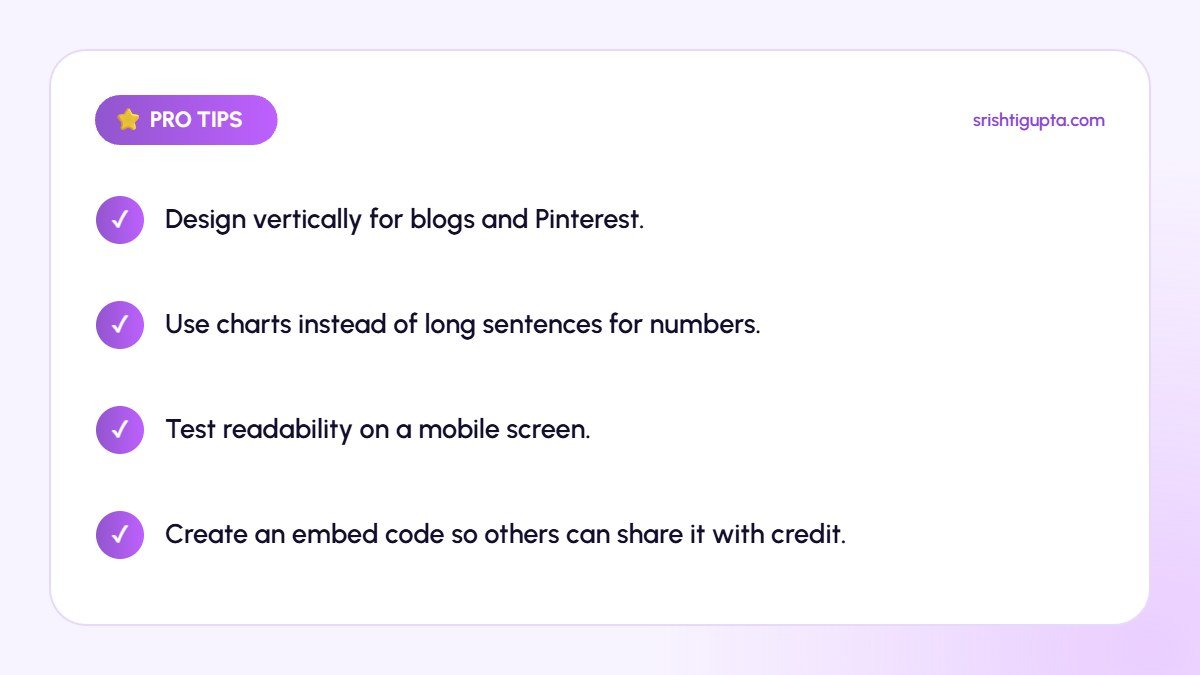
- Design vertically for blogs and Pinterest.
- Use charts instead of long sentences for numbers.
- Test readability on a mobile screen.
- Create an embed code so others can share it with credit.
Common Mistakes to Avoid
- Cramming too much information into one graphic.
- Using decorative icons that confuse the meaning.
- Low contrast text that is hard to read.
- Missing or unreliable data sources.
Frequently Asked Questions
Which tool is best for creating infographics?
Canva is easiest for beginners, while Adobe Illustrator and Figma offer more control for designers. Venngage and Piktochart also provide infographic templates.
How long should an infographic be?
Keep it as short as the message allows. For social media, a single screen or a carousel works best, while blog infographics can be longer.
Do infographics help SEO?
Yes. Useful infographics can earn backlinks and shares, and with descriptive alt text and surrounding content they support image search visibility.
Final Thoughts
Great infographics make complex ideas feel simple. Focus on one message, design with clear hierarchy and accurate data, and your visuals will be read, remembered and shared.
Need expert help? Srishti Gupta is a digital marketing expert in Ludhiana. Explore her graphic designing services or get in touch to discuss your project.